


 Auteur vérifié
You’ve carefully selected the best CRM on the market. Added the project management tool that everyone recommends. Opted for the best-rated time tracking solution. And topped it all off with an invoicing tool, a collaboration platform, reporting software and, of course, a few handy spreadsheets for special cases.
In short, you’ve built the perfect stack. The best in each category. A logical approach, don’t you think?
Except that this best-of-breed strategy hides a far less attractive reality. Beyond the monthly subscriptions you religiously pay, there are invisible costs that can easily multiply your bill by three or even four. Between phantom licenses, evaporating productivity and hours spent on maintenance, your “optimized” stack could well be your biggest hidden expense.
Let’s take a look at what this stack oftools really costs you.
If you think that the cost of your tools is limited to the monthly invoices you receive, here’s the reality.
The figures speak for themselves. In 2024, the average company will spend $1,040 per employee per year on SaaS subscriptions alone, according to a Gartner study. For a 25-strong agency, that’s already $26,000 a year. And we’re talking about an average here.
The problem? This average masks an even more worrying reality: the average company uses 125 different SaaS applications. One hundred and twenty-five. Let that sink in for a second. Even for a medium-sized organization, we’re easily talking about 7 to 15 main tools that gradually accumulate. You start with a CRM, add a project management tool, then a billing tool… and before you know it, the stack has exploded.
Here’s the kicker: companies are only using 49% of their provisioned licenses. In other words, you’re paying for more than half of the empty seats.
According to Zylo’s SaaS Management Index 2024, which analyzes over 30 million licenses and $34 billion in SaaS spending, companies waste an average of $18 million a year on unused licenses. Even if your agency doesn’t reach these figures, the principle remains the same on your scale.
In concrete terms, these phantom licenses come from :
A quick audit of your current licenses is likely to yield some unpleasant surprises.
Now let’s talk about redundancy, that discreet but costly scourge. According to the same Zylo study, the average company has :
In a typical agency, we often find this absurd configuration:
The result? Five different tools that do partially the same thing, with multiple double entries and no coherent overview.
| Type of cost | Average amount | Source |
| SaaS expenditure per employee/year | 1 040 $ | Gartner 2024 |
| Waste of unused licenses | 18M/year (average company) | Zylo 2024 |
| Percentage of licenses actually used | 49% | Zylo 2024 |
| Average number of redundant tools | 11 (project management only) | Zylo 2024 |
But the bill doesn’t stop there. The real cost lies in what your teams are NOT doing because of that scattered stack. And this is where the figures become truly alarming.
Imagine this scenario: your project manager consults the CRM to check customer information, switches to the project management tool to update a task, opens his time tracking tool to enter his time, then checks the spreadsheet to see if the project budget still stands. Four different applications for a single coherent action.
This constant to-and-fro between applications has a name: context switching. And it literally massacres your teams’ productivity.
The data speak for themselves. According to the Anatomy of Work Index, workers switch between 9 different applications on average every day. Some studies even show that developers switch tasks 13 times an hour, spending just 6 minutes on one task before switching to the next.
The cost? Context switching can reduce productivity by up to 40%. This isn’t a wild guess; it’s the result of multiple converging research studies, including one by the American Psychological Association, which shows that adults who regularly switch between tasks have significantly lower overall productivity.
Let’s translate that into hard-earned euros:
And that’s just one hour a day. For many teams juggling 7 or more tools, the actual loss is far greater.
Here’s another chilling figure: according to research by the University of California at Irvine, it takes an average of 23 minutes and 15 seconds to regain full concentration after an interruption. Some studies even extend this estimate to 25 minutes.
Think about it for a moment. Twenty-three minutes to regain your flow state after each change of context.
The typical scenario in an agency with a split stack:
Recent research shows that a worker undergoes an average of 12 contextual changes in 30 minutes during active periods. With 23 minutes to recharge each time, it’s easy to see why 40% of productive time evaporates.
For an 8-hour day, that’s around 3 hours of lost productivity every day. Every day. For every employee.
Beyond the raw productivity figures, context switching has a measurable and documented human impact.
45% of workers say they feel less productive because of constant juggling between applications, according to Cornell University’s Workgeist Report. And 43% say that frequently switching between tools and contexts is “very tiring” mentally.
A study at the University of California, Irvine, measured the psychological state of participants after just 20 minutes of repeated interruptions. The result: a significant increase in stress, frustration, perceived workload and pressure.
But your teams experience this all day, every day.
What are the medium-term consequences?
An Atlassian report estimates that context switching costs the global economy around $450 billion a year. This astronomical figure reflects the scale of the problem on a global scale. For your agency, even if we’re talking “only” about a few tens or hundreds of thousands of euros, the impact on competitiveness is real and immediate.
And there’s more to come. Every new tool in your stack creates friction, which is costly, but tends to be underestimated, if not completely forgotten.
Reality? ” Later” never happens. Or under conditions so degraded that the result is worse than the initial problem.
Direct consequence:
Time spent on these “computer plumbing” tasks? Easily 5 to 10 hours a week for an average team. That’s 250 to 500 hours a year that create absolutely no value for your customers.
Each tool added to your stack represents a new learning curve for your teams.
The impact is manifold:
Let’s take the concrete example of a new project manager joining your agency:
What’s the difference? Around 6 to 8 weeks of productivity saved over the first year.
For a project manager who costs €60,000 a year, that’s around €7,000 in lost productivity just on onboarding.
Then there’s all that invisible maintenance time that silently accumulates:
Renewal management :
Access and permissions management :
Technical support and assistance :
Updates and compatibility :
In total, for a person in charge of the operational management of your stack (often an IT or ops manager, or even a CFO), you can easily count on 5 to 10 hours per month of pure administrative work. Over the course of a year, this represents 60 to 120 hours devoted solely to keeping the stack afloat.
With an hourly rate of €60-80, we’re looking at €4,800 to €9,600 a year just in administrative maintenance time.
Beyond the euros and hours lost, a fragmented stack deprives you of a crucial competitive advantage: the ability to pilot your business in real time and react rapidly to opportunities.
The fundamental problem with a dispersed stack? Your data is scattered in 7 different places, with no coherent overview.
The consequences are direct:
Impossible to see in real time
Tedious, manual reporting
Decisions based on incomplete or obsolete data
Missed opportunities
In a fast-moving market, the ability to pivot quickly is a major competitive advantage. A fragmented stack takes it away.
Longer reaction times
Difficulty adapting your offer
Vs. with an integrated platform :
The difference between seizing a market opportunity or passing it on to a more agile competitor.
Now let’s talk about an insidious phenomenon: Shadow IT, i.e. the tools your employees use without your knowledge.
The figures are staggering: according to Zylo, more than a third of the applications used in companies are Shadow IT. And 67% of IT managers cite the purchase of unauthorized tools as one of their main challenges.
Why do your teams do this? Often because your official stack is so cumbersome and fragmented that they’re looking for workarounds to be efficient. “I use this personal to-do tool because our official tool is too complicated.” “I pay for a little SaaS out of my own pocket because it saves me 2 hours a week.”
The risks are many:
Shadow IT is often the symptom of an overly complex official stack. And it adds yet another layer of hidden costs and risks.
Now let’s do the math. Here’s how to estimate the real cost of your software infrastructure, beyond simple monthly subscriptions.
For an agency of 20 people with 7 tools at ~25 €/user/month on average :
But with 51% waste: real cost for effective use = ~85,000 €/year
2. Productivity costs (the hidden bomb)
For a team of 20 people at an average cost of €60,000/year (i.e. ~€35/hr):
And we remain conservative with only 1 hour lost per day.
Estimate for a medium-sized agency :
It’s hard to put a precise figure on it, but a single contract lost at €50,000 because you couldn’t respond quickly enough about your team’s availability is enough to ruin the year.
Let’s take our example of a 20-person agency with 7 tools:
Actual annual cost of an exploded stack :
━━━━━━━━━━━━━━━━━━━━━━━━━━━━━━━━━━━━━━━━━━━━
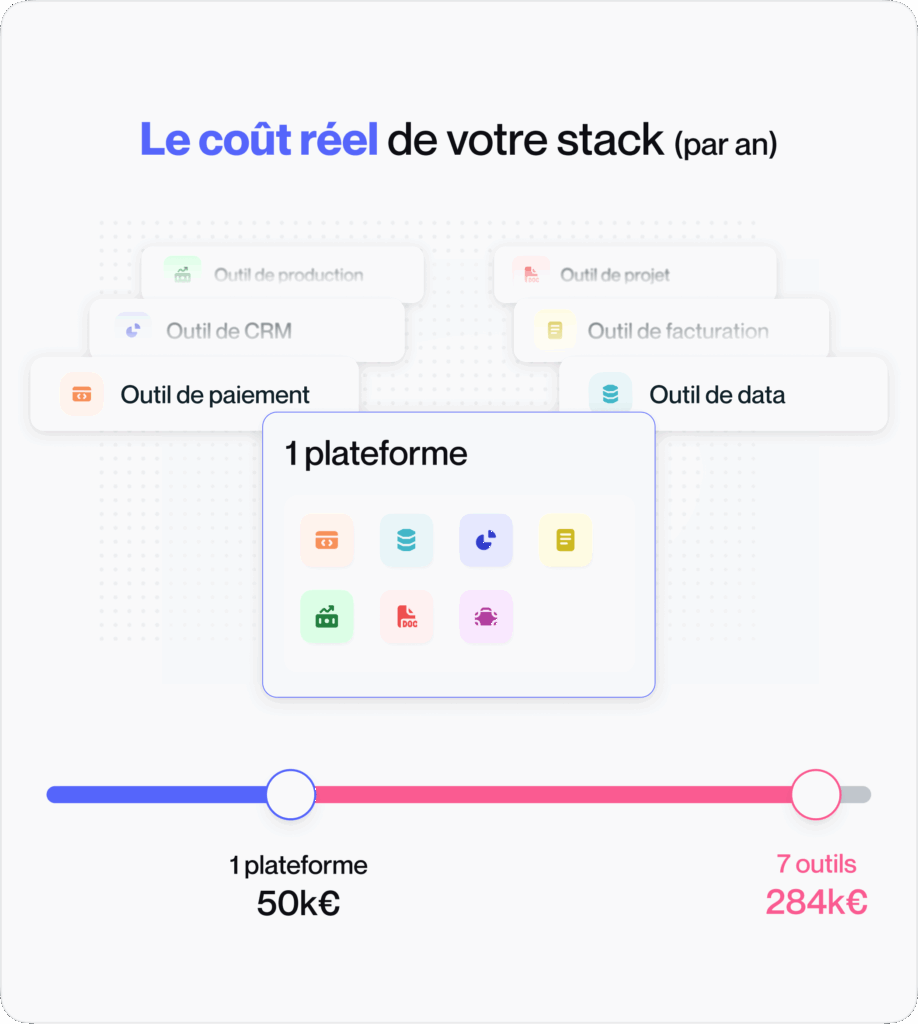
TOTAL COST: €284,000/year
Integrated solution :
━━━━━━━━━━━━━━━━━━━━━━━━━━━━━━━━━━━━━━━━━━━━
NET SAVINGS: ~€209,000/year
You read that right: for a 20-strong agency, the difference can amount to over €200,000 a year.
And these figures are conservative. Many agencies discover, when they do the exercise honestly, that their stack costs them even more.
Before Furious, we had several tools managed by division, but they were complex to manage. With Furious, we standardized everything with a dedicated tool for the agencies. It’s really been a game changer for internal communication and team productivity.
Harold Gardas, CEO Köm Média
Faced with this reality, more and more agencies are opting for consolidation. And feedback shows that it’s not just a question of costs, but of overall performance.
From the very first month of migration to an integrated solution, the benefits are tangible:
One subscription instead of 7
A single training course for the whole team
A single point of contact for support
Unified real-time data
For an all-in-one agency management platform, the typical timeline looks like this:
Month 1-2: Immediate savings
Month 3-4: Productivity gains
Month 6: Balance point
Month 12: Solid positive ROI
To take our example of a 20-strong agency saving ~€209,000 a year, the ROI becomes positive as early as 3ᵉ months if the investment in migration and training is €50,000.
Simplified scalability
Rediscovered agility
Real-time visibility
Increased competitiveness
Stacking up 7 tools to “choose the best in each category” sounds logical on paper. In reality, it’s a strategy that can cost you 3 to 4 times more than the sum of simple subscriptions.
Between phantom licenses, productivity evaporated by context switching, time swallowed up in maintenance and integration, and missed opportunities due to lack of visibility, the real cost can easily reach €250,000 to €350,000 per year for a team of 20 people.
The real question is no longer “Can I afford to invest in an integrated solution?” but rather“Can I afford NOT to?”
In a market where every point of margin counts, where responsiveness is a decisive competitive advantage, and where the well-being of teams has a direct impact on their performance, continuing to pile up tools is like throwing money down the drain.
Consolidation is no longer a comfort option. It’s a strategic necessity to remain competitive.
A medium-sized agency (15-50 people) generally uses between 7 and 15 main tools to manage its business: CRM, project management, time tracking, invoicing, accounting, collaboration, reporting, etc. To these are often added secondary tools and Shadow IT (tools used by employees without official validation). To these are often added secondary tools and Shadow IT (tools used by employees without official validation). Studies show that the average company, across all sectors, uses a total of 125 SaaS applications.
There are a number of ways to do this: ask each tool for a license usage report (most SaaS products offer this feature), perform a monthly audit of the latest connections per user, cross-reference the list of licenses with your current organization chart to identify departed collaborators, and survey your teams directly on the tools they actually use on a daily basis. You can also use SaaS Management platforms that automate this detection. On average, 51% of provisioned licenses are not used, or are used only to a limited extent.
This is a legitimate fear, but the reality shows the opposite. With 7 different tools, you have 7 potential points of failure, 7 security policies to maintain, 7 risks of breach, and no overall vision in the event of a problem. A quality integrated platform generally offers enhanced security (only one system to secure, but better), centralized backups, a single, clear SLA, and a dedicated support team. What’s more, modern solutions use robust cloud infrastructures with redundancy. The real risk is to have a system so complex that no one can really control its security.
Change is always a challenge. The key is to start from the day-to-day problems experienced by teams: time wasted looking for information in 7 different places, frustrating double entries, the impossibility of getting an overview. Involve your teams right from the start of the selection process, have them test the integrated solution beforehand, and show them in concrete terms how their daily lives will be simplified. Identify “champions” in each team who can evangelize the solution. And above all: support the change with high-quality training. Resistance drops drastically when people understand that the new tool will really save them time.
For an agency of 15-30 people, you should generally allow 2-3 months for a well-prepared migration: 2-3 weeks of scoping and preparation (process mapping, data cleansing), 3-4 weeks of parameterization and data migration, 2-3 weeks of training and support for teams, then 3-4 weeks of running-in with close support. The trick is to proceed gradually: start with a pilot department, validate that everything is working, then roll out to the rest of the organization. Some agencies opt for a “big bang” migration during an off-peak period (August, end of year), while others prefer a more gradual approach over 4-6 months. The most important thing is not to neglect the training phase: this is what guarantees adoption.
There are several ways to do this: ask each tool for a license usage report (most SaaS products offer this feature), perform a monthly audit of the latest connections per user, cross-reference the list of licenses with your current organizational chart to identify departed collaborators, and directly survey your teams on the tools they actually use on a daily basis. You can also use SaaS Management platforms that automate this detection. On average, 51% of provisioned licenses are not used, or are used only to a limited extent.
It’s a legitimate fear, but reality shows the opposite. With 7 different tools, you have 7 potential points of failure, 7 security policies to maintain, 7 risks of vulnerability, and no global vision in the event of a problem. A quality integrated platform generally offers enhanced security (only one system to secure, but better), centralized backups, a single, clear SLA, and a dedicated support team. What’s more, modern solutions use robust cloud infrastructures with redundancy. The real risk is to have a system so complex that no one can really control its security.
Change is always a challenge. The key is to start from the day-to-day problems experienced by teams: time wasted searching for information in 7 different places, frustrating double entries, the impossibility of getting an overview. Involve your teams right from the start of the selection process, get them to test the integrated solution beforehand, and show them in concrete terms how their daily lives will be simplified. Identify “champions” in each team who can evangelize the solution. And above all: support the change with high-quality training. Resistance diminishes drastically when people understand that the new tool will really save them time.
For an agency of 15-30 people, you should generally allow 2-3 months for a well-prepared migration: 2-3 weeks for scoping and preparation (process mapping, data cleansing), 3-4 weeks for parameterization and data migration, 2-3 weeks for team training and support, then 3-4 weeks for running-in with close support. The trick is to proceed gradually: start with a pilot department, validate that everything is working, then roll out to the rest of the organization. Some agencies opt for a “big bang” migration during an off-peak period (August, end of year), others prefer a more gradual approach over 4-6 months. The most important thing is not to neglect the training phase: this is what guarantees adoption.